Strava and Sense of Consistency
September 2024
At this point in my life, starting a new routine that isn't lean toward self-destruction, for instance walking everyday for at least 5 km, is not an easy task. Modern era of digital world provide human with a lot of information, and distraction. Digital world distraction reduce our ability to stay focus doing an activity for quite long period of time; reading, walking/running or studying.
To keep me motivated and accountable I decided to develop a public record of my walking/running routine by integrating STRAVA API to own website. So when I skipped a walk I would be a bit embarrass. It also trigger some small happiness when I see the graph of consistency.
Strava API Integration
To be able using strava API first we need to setup our application account at api setting. Strava will provided us a credentials (client id, client secret, access token, refresh token) to access their API.
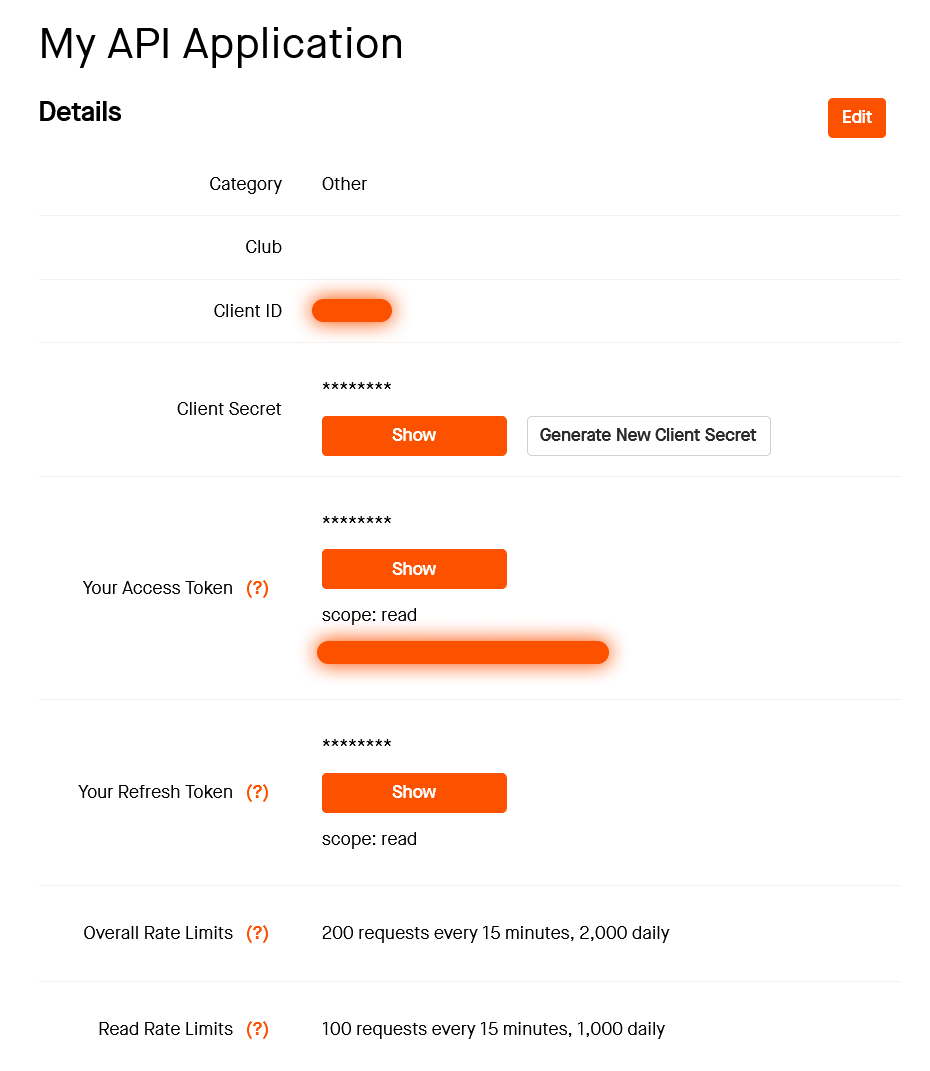
Figure 1. API settings
Strava API allowed developer accessing some of their api such as athlete, athlete activities, routes etc. But by default they only give athlete data scope access token. To be able to access athlete activities data, we need a read_all access token, to get it, Strava using OAuth authentication flow. So this is why we need to get it manually.
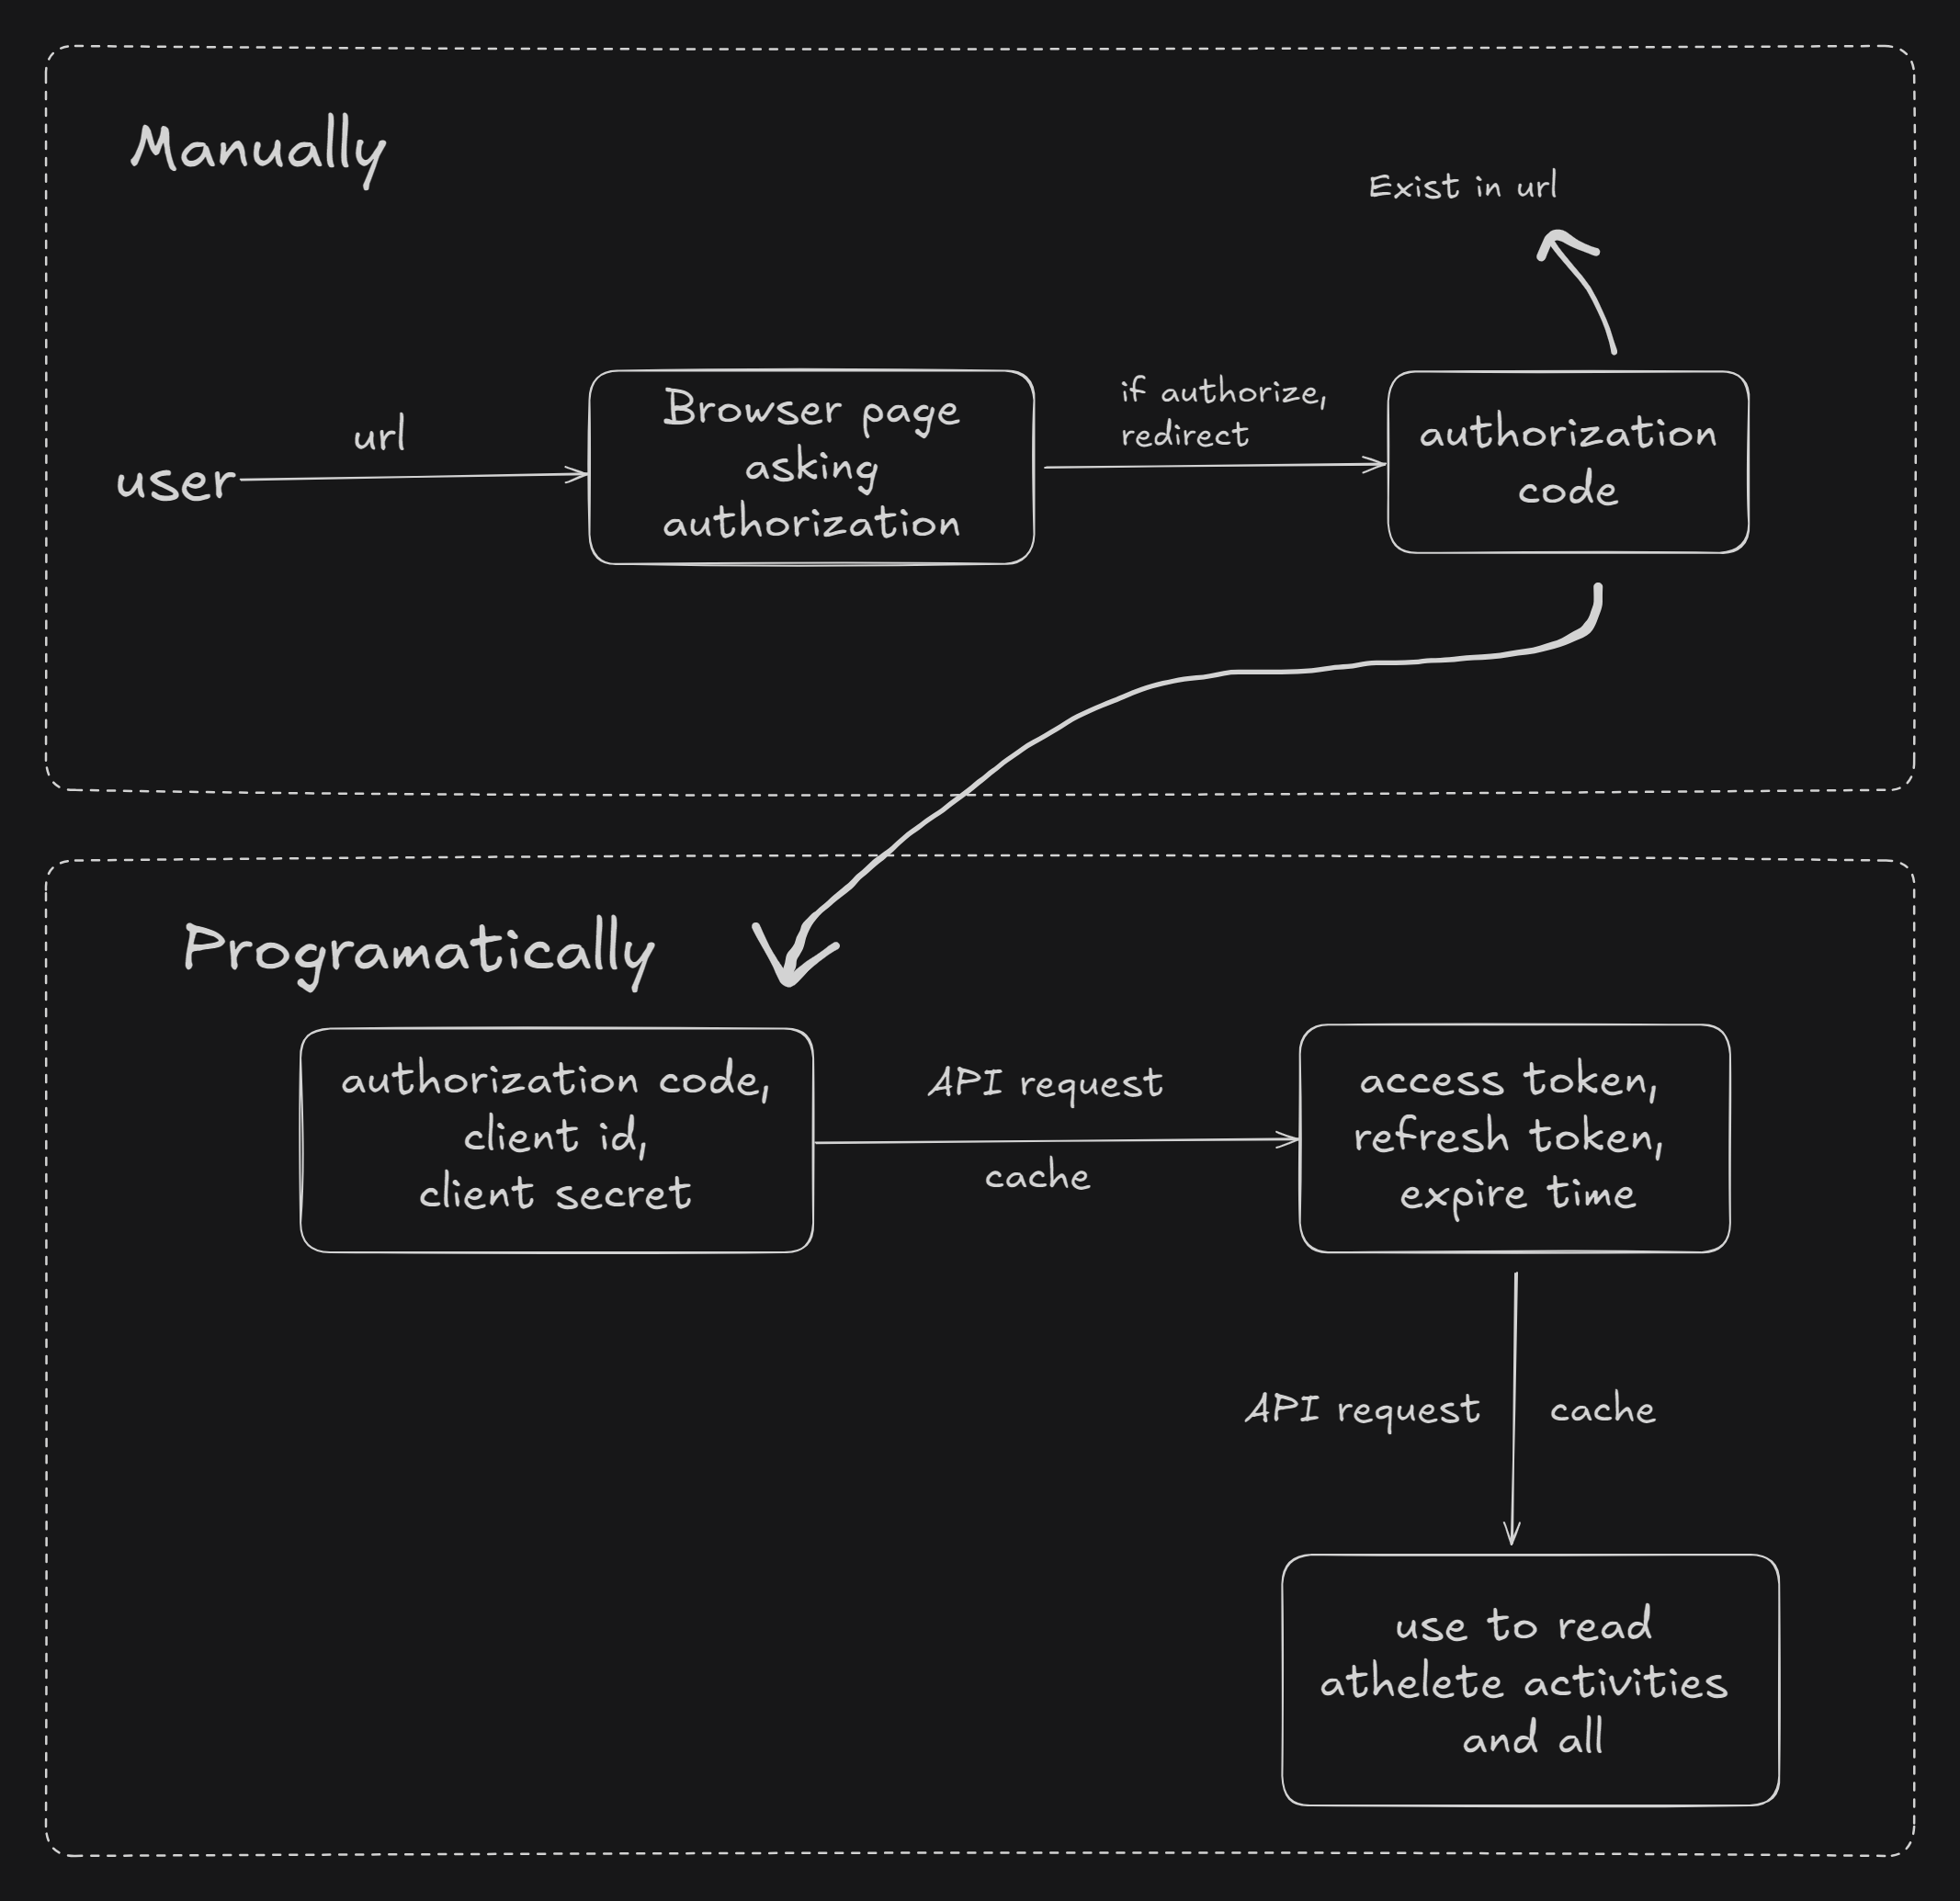
Figure 2. Acquiring Access Token
Strava OAuth 2.0 authentication starts by redirecting user to their page, to let user authorize an access to developer application. After user give the access, strava will redirect them back to url that you set in the api application settings, the URL query string will include an authorization code and the scope granted by the athlete/user.
With the authorization code now we can request the access token.
curl -X POST https://www.strava.com/oauth/token \
	-F client_id=YOURCLIENTID \
	-F client_secret=YOURCLIENTSECRET \
	-F code=AUTHORIZATIONCODE \
	-F grant_type=authorization_code
Finally we have all the necessary credentials to do request athlete activities without needing to do the OAuth 2.0 authentication anymore.
{
    "token_type": "Bearer",
    "expires_at": 1562908002,
    "expires_in": 21600,
    "refresh_token": "REFRESHTOKEN",
    "access_token": "ACCESSTOKEN",
    "athlete": {
        "id": 123456,
        "username": "MeowTheCat",
        "resource_state": 2,
        "firstname": "Meow",
        "lastname": "TheCat",
        "city": "",
        "state": "",
        "country": null
    }
}
You are not supposed to store this credentials unless it is your own data, in this case I am the owner of the data.
After acquired the read_all access token, now we can use it to access athlete activities endpoint, by sending a request with our own API credentials (client_secret, client_id, refresh_token).
Here how it is done with Next.
const client_id = process.env.client_id
const client_secret = process.env.client_secret
const refresh_token = process.env.refresh_token

const getAthleteActivities = async () => {
    const getAccessToken = await fetch(
        `https://www.strava.com/oauth/token?client_id=${client_id}&client_secret=${client_secret}&grant_type=refresh_token&refresh_token=${refresh_token}`,
        { method: "POST" }
    )
    const authData = await getAccessToken.json()

    const stravaData = await fetch(
        "https://www.strava.com/api/v3/athlete/activities",
        {
            headers: { Authorization: `Bearer ${authData.access_token}` },
        }
    )
    let data = await stravaData.json()
    return data
}
and finally I can display latest activities as a table.
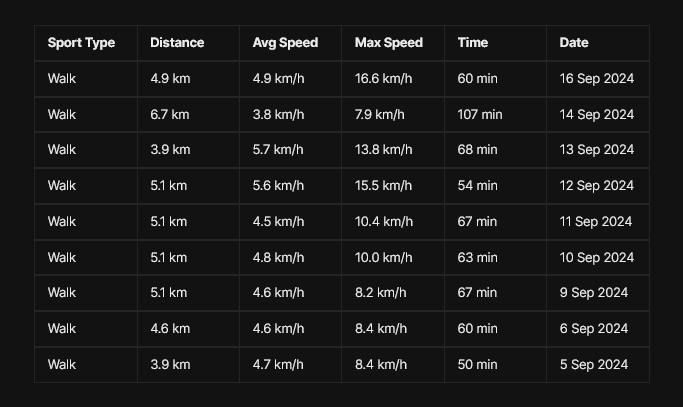
Figure 3. Athlete Activities Table
Visualization
Display the data as table is good, but it will be more right to visualize it as a chart. Chart help to quickly see your consistency and whether you make an improvement or setback.
Here I use chartjs library to visualize the graph. The chartjs documentation is pretty straightforward and easy to use.
"use client"

import { parseISO, format } from "date-fns"
import { Line } from "react-chartjs-2"
import Chart from "chart.js/auto"
import { CategoryScale } from "chart.js"

Chart.register(CategoryScale)

const StravaChart = (props) => {
    const activities = [...props.activities].reverse()

    const chartData = {
        labels: activities.map((item) =>
            format(parseISO(item.start_date), "E d")
        ),
        datasets: [
            {
                label: "Distance (km)",
                data: activities.map((item) => item.distance / 1000),
                yAxisID: "y",
            },
            {
                label: "Time (minutes)",
                data: activities.map((item) => item.elapsed_time / 60),
                yAxisID: "y1",
            },
        ],
    }

    const options = {} // put chart options you want here

    return <Line data={chartData} options={options} />
}
You can customize the style of your chart the way you like with the options.
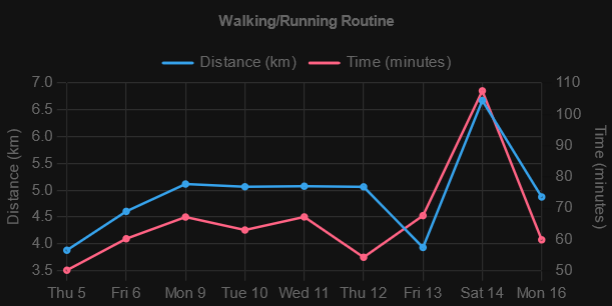
Figure 4. Activities Chart
And voila! we got ourselves a nice looking chart. we can see how we improve by looking at the gap between two point of distance and time graph. As the gap bigger mean we make improvement by covering more distance in less time.
Conclusion
Hopefully we this walking/running habit 'dashboard' being public will keep me accountable and consistent. Perhaps, it will also inspire some people to start their own good habit and shared it to the internet.